Many L&D professionals struggle to quantify the business impact of training programs accurately. This leaves you unable to prove your employee training ROI fully. Common methods like smile sheets and gut feelings fail to provide concrete data.
Are you frustrated with tracking wishy-washy training return on investment?
Do random ROI metrics leave you guessing about real training value?
When it comes to training budget, leadership wants to see cold, hard stats that positively affect the bottom line, not just happy self-reported surveys. Without calculating ROI of employee training and development giving definitive ROI proof tied to business results, your L&D budget sits on the chopping block.
Fortunately, a clear methodology exists to track comprehensive training effectiveness and calculating training ROI from learning, to performance, to business impact…
Why Should We Measure the ROI of Training
Measuring the ROI of training initiatives is crucial as it quantifies the financial benefits derived from effective training programs against their associated costs. By evaluating ROI, organizations can assess the success of their learning efforts and understand the business outcomes achieved. The cost-benefit ratio, which compares the monetary benefits to the total training costs, provides a clear picture of financial gains. Training costs encompass development expenses, instructor fees, materials, equipment, and employee time spent in training sessions. A positive ROI indicates that the financial benefits exceed these costs, showcasing the value of the training initiative.
Analyzing training ROI is not just about immediate financial benefits; it also plays a vital role in continuous improvement. By examining the data, organizations can identify areas for enhancement in future training initiatives, ensuring that they align with business goals and deliver optimal results. Conducting a business impact study can further solidify the understanding of training’s impact, offering insights into employee performance and organizational success. Benchmarking ROI results against industry standards or similar organizations can provide additional context, guiding strategic decisions to maximize the effectiveness of training programs and drive sustained financial gains.
Follow the 5-10 Levels to ROI Clarity
Similar to the Kirkpatrick model for measuring the effectiveness of training, looking at these 5 core levels provides a comprehensive view into the true ROI of corporate training for the trainee, the department, and the overall organization. It moves beyond just smile sheets to data-driven insights on training success.
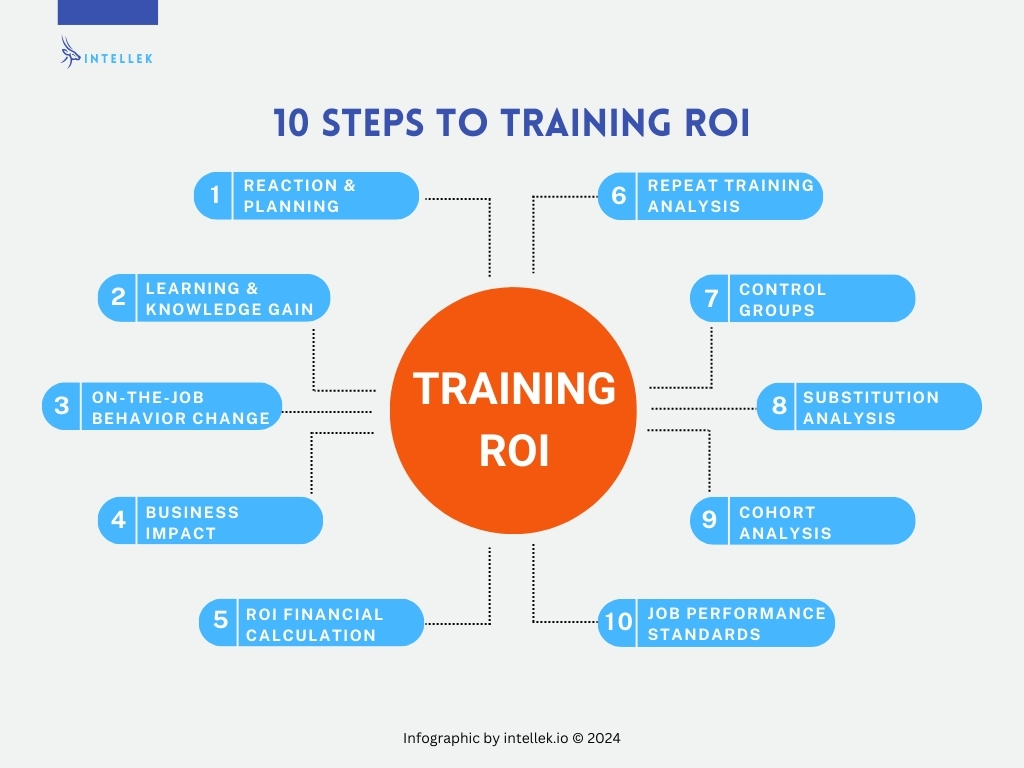
Following these 5 evaluation levels provides the full data picture:
- Reaction & Planning
- Learning & Knowledge Gain
- On-the-Job Behavior Change
- Business Impact
- ROI Financial Calculation
Additionally, applying these 5 perspectives gives a 360-degree view of full training value:
- Repeat Training Analysis
- Control Groups
- Substitution Analysis
- Cohort Analysis
- Job Performance Standards
Practical Ways to Measure Training ROI
Some say you can’t manage what you don’t measure. To get to the bottom of your true training ROI, you need a methodology to measure across 5 critical levels: trainee reaction, learning outcomes, on-the-job behavior change, business impact, and overall training program ROI.
By evaluating metrics at each of these levels, you gain clear data-driven insights into the tangible value training drives at the participant, department, and organizational levels.
Here is a detailed breakdown of what to measure at each level:
1. Reaction & Planning
Measure participant reactions, satisfaction, and planned action items from the training through surveys and feedback forms.
This shows if your training hits the mark with employees.
How to do this: Send digital feedback forms immediately after training completion as well as one week later to allow time to plan action items. Survey metrics to collect include satisfaction rating, content relevance rating, instructor quality rating, open-ended feedback, and listing of key takeaways and action plans. A benchmark goal is an average satisfaction rating of 4 out of 5 from 80% of participants.
2. Learning & Knowledge Gain
Assess learning and knowledge gained from before to after the training through tests, assessments, or skill demonstrations.
This indicates if learning objectives were achieved.
How to do this: Conduct knowledge assessments directly before and directly after training through online quizzes and skill testing scenarios. Or have learners demonstrate key skills in a simulated environment to be rated on observation checklists. Metrics include % improvement from pre-assessment to post as well as % achieving passing standard score (e.g. 85%).
3. On-the-Job Behavior Change
Evaluate on-the-job behavior change and capability improvement after the training through observation, supervisor input, and productivity metrics.
This shows actual skill transfer back to work.
How to do this: Field observation by managers against standardized performance scorecards at 1 month into 3 months post-training completion. Track productivity data like calls/tickets closed per rep, time per task efficiency, and lead conversion rates monthly. Measure against a 3-6 month control period baseline before training as your benchmark.
4. Business Impact of Training
Measure business impact and results influenced by the training such as increased sales, decreased costs, higher engagement scores, and better safety through KPI tracking over time.
This demonstrates the bottom-line payoff.
How to do this: Compare monthly metrics tied to training topics across teams: customer satisfaction (CSAT) scores for support training, new customer revenue growth for sales training, and quality defect rate for QA training. Measure 3-6 months before launch to 6+ months after at regular intervals to identify trends and impact against existing benchmarks.
5. Training ROI Financial Calculation
Compare the business impact’s monetary benefits against the training program’s total cost to calculate ROI of employee training and development in financial terms, a form of cost-benefit analysis.
Aim for at least a 100%-200% ROI as a solid training investment.
How to do this: Tabulate all costs of designing, developing, and delivering training. Track managers’ time in training sessions as well as lost productivity time for learners if completed during working hours multiplied by their salary rates. Calculate the total program cost. Then total measurable benefit value from business impact metrics that are tracked. Divide benefit value by cost to determine ROI multiple over 12 months from program completion.
Simple ROI Formula: ROI = (Benefit Value) / (Total Program Cost)
Where:
Total Program Cost = Cost of Designing + Developing + Delivering
- Design cost
- Development cost
- Delivery cost (tools/platform)
- Manager time in training salary cost
- Learner lost productivity time x salary rate
Benefit Value = Total measurable benefit from business impact metrics over 12 months
- Revenue increase
- Cost savings
- Productivity gains
- etc…
ROI Multiple = The ratio between the monetary benefits compared to total program costs over 12 months after program completion.
Aim for your training ROI to be at least 100-200%. This means a return of $2-3 for every $1 invested in training through business impact. The key is quantifying both the total cost as well as the total economic value the program then drives. Compare the two for the full picture of calculating ROI of employee training and development.
Corporate Training ROI Analysis Example – Compare money gained to costs. If your training costs $100,000 but increases revenue by $300,000, then ROI is $300,000 – $100,000 = $200,000.
So for every $1 spent, $3 was gained back. This positive ROI justifies spending on training.
Tracking monetary returns often needs to happen for 6-12 months after training to allow gains to accumulate through better performance. A compelling training ROI case helps secure ongoing budgets for strategic L&D programs aligned to company results.
Free Training ROI Calculator Tool
Based on the premise laid out above, we’ve created this useful ROI calculator tool for you to use and generate some estimated ROI figures for your training programs. Be sure to use the same currency in each field to get the most accurate result.
Taking a 360-Degree View of Training ROI
While the 5 core levels provide the foundation for measuring training effectiveness and ROI, additional perspectives can round out your analysis to tie training tightly to critical individual and organizational performance.
Applying these 5 supplementary evaluation approaches gives you a comprehensive 360-degree view that connects training to overarching business success. Adding metrics from these areas into your overall ROI methodology eliminates blindspots and helps showcase the complete value training brings.
Here is more detail on measuring each perspective:
6. Repeat Training Analysis
Track performance metrics before an initial training, after the training, and after repeats of the same training over time.
This helps assess the retention of skills and information.
7. Control Groups
Compare groups of employees who receive the training to similar groups who do not through random assignment.
Measuring differences in KPIs helps isolate the impact of training.
8. Substitution Analysis
Calculate the expense of viable alternatives to training such as hiring new staff, lawsuits from lack of training, or lost sales opportunities.
This substitutes as the potential cost without training.
9. Cohort Analysis
Identify patterns in key performance metrics over time by grouping trainees by characteristics like location, department, level, and demographics.
Trends show who benefits most from training.
10. Job Performance Standards
Use pre-defined benchmarks for productivity, quality, accuracy, speed, ratings, and other critical job expectations before and after training to measure improvement.
This keeps metrics consistent and objective.
Getting to the Bottom of ROI in Training
Getting a definitive measure of your true training return on investment requires a methodology that ties program impacts from the individual contributor up to the overall organization's bottom line.
By combining metrics across the 5 core evaluation levels (reaction, learning, behavior change, business impact, ROI calculation) as well as the 5 additional perspectives (repeat training, control groups, substitution analysis, cohort analysis, job performance standards), L&D leaders can eliminate guesswork and showcase training's complete value.
Following this dual-tiered approach provides a concrete ROI calculation grounded in tangible business results - moving far beyond random smile sheets or gut feelings.
With full data-backed clarity into training effectiveness across employees, departments, and the entire company, you can confidently prove and improve your L&D programs' financial ROI above the 100-200% solid investment threshold.
Use Training Technology to Increase ROI
Using a modern learning management system (LMS) to deliver training can directly contribute to boosting your overall training return on investment (ROI) in a few key ways:
- Tracking & Reporting - A good LMS has seamless tracking, analytics, and reporting to compile data on learner participation, knowledge assessments, skill application, and training outcomes. This provides tangible metrics for the 5 Core Levels and 5 Additional Perspectives to measure ROI.
- Personalization - Advanced LMSs leverage AI and machine learning to tailor training content, resources, and recommendations to each employee's strengths, needs, and goals. This personalization drives higher engagement and knowledge retention for improved on-the-job performance.
- Automation - Automating mundane administrative tasks, scheduling, reminders, and notifications lets your team focus on the bigger picture training strategy - not manual busywork. The efficiency of automation also leads to an optimized L&D budget and resources spent wisely.
- Accessibility - With today's distributed digital workforce, an LMS allows employees to access interactive online training anytime on any device. This flexibility and mobility can remove barriers to learning and participation for higher adoption.
- Complementary Tech - Modern LMS platforms integrate with video apps, gamification tools, social features, and more that all complement engaging and effective training. More engaged learners mean higher chances of on-the-job skill application.
So by leveraging an LMS as your central training delivery mechanism, you set up seamless tracking for transparency into ROI. You also drive employee engagement, knowledge retention, skill application, and ultimately clearer business impacts from your learning programs.
Get Your Free LMS ROI Calculator
Are you looking to implement a new learning management system at your organization? Stop guessing about the ROI of investing in training tech. Download our exclusive LMS Buyer’s Toolkit today to get a free calculator that will help you measure the return on investment in a learning management system.
Start Tracking Your True Training ROI Today
Now that you've seen the methodology and value of measuring training return across the 5 core levels and from multiple perspectives, it's time to implement this within your organization.
Here are some next steps to get started:
- Review your existing training evaluation plans and identify gaps where additional metrics aligned to the 10 levels could be captured. Take inventory of what data you already have.
- Build out surveys and knowledge assessments to quantify trainee reactions, learning retention, and planned action items from each program.
- Work with managers to implement observations, tracking, and productivity benchmarking to measure on-the-job behavior change after training.
- Dig into your business intelligence to connect training participation and completion data to key performance indicators over time - this is your gold standard for impact!
- Construct ROI financial calculations comparing program costs to the business impacts identified. Shoot for at least 100-200%.
Following these steps methodically over your next few training initiatives will provide that robust, data-backed view into true program value. From there you can fine-tune content and delivery to maximize ROI.
If undertaking this feels daunting, don't fret! Consider leveraging a learning management system (LMS) that can automate much of this robust tracking, analytics, and reporting across the key levels we covered. Most importantly, an LMS gives you clarity so you can focus resources on what drives impact and value for your organization.

Intellek (formerly TutorPro) is a founding member of the learning technology industry. With a presence in the USA, UK, Canada, and the EU – for over 30 years we have pioneered the development of cutting-edge eLearning software and online training solutions, with a large and diverse portfolio of international clientele.
Disclaimer: We use all the tools available including generative AI to create relevant and engaging content.